|
|
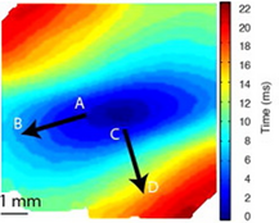
semi-automatic conduction velocity calculation
|
|
|
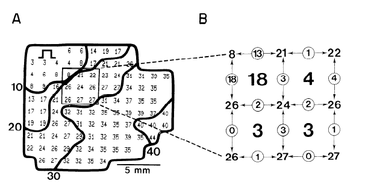
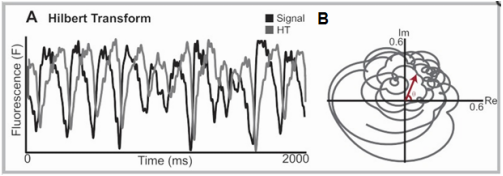
Quantification of spatial inhomogeneitiesQuantification of spatial inhomogeneities in conduction is useful for evaluating the vulnerability of the myocardial substrate for reentrant arrhythmias. We plan to develop novel methods to quantify spatial inhomogeneities in conduction in both the time and frequency domain.
|
Detection of ArrhythmiasWe will integrate quantitative results of cardiac electrophysiological mapping, and design an algorithm to detect and analyze arrhythmias. The project will mostly focus on atrial and ventricular fibrillation, which is the irregular heart contraction of cardiac muscle fibers.
|
|
Design Specifications
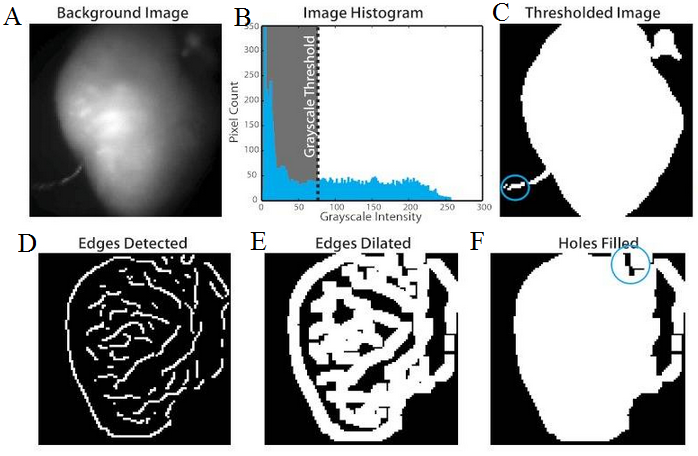
- The software should be able to process optical imaging data and remove unwanted background noises. The signal filters should be achieved with pass band tolerance . In addition, optical signals should have a constant baseline to avoid skew in action potential analysis. The total running time of the signal processing should be asymptotically quicker than .
- The optical mapping software should be able to analyze the cardiac conduction pattern and identify spatial pathological heterogeneity, including the numbers and locations of heterogeneity points. Furthermore, the software should include multiple analytical methods for inhomogeneity analysis.
- A machine learning model should be produced based on a training set that includes both simulated data and actual data from the client. Both types of data would be visually inspected and assigned an inhomogeneity level between 0 and 5, where 0 represents complete homogenous conduction, and 5 represents severe inhomogeneity. The predicted inhomogeneity level (also based on the 0 to 5 scale) will then be determined by the selected model by combining all chosen alternative methods. The training error of the machine learning model, defined as the , should not exceed 0.1. The selected model should also be tested on a test data set with error less than 0.2.
