Feasibility of Technology and Literature Support
- The principles and techniques of cardiac optical mapping have been extensively reviewed in Laughner, J.I., et al. [1], where the standard methods for signal processing, activation maps and cardiac conduction study are discussed in detail. In addition, the Efimov Lab provides a MATLAB-based open source software package called RHYTHM that can load and process optical imaging data. Therefore, the signal processing functions desired in this project are easily achievable based on functionality available in RHYTHM.
After optical imaging data are processed, the desired software needs to analyze the conduction pattern of the heart and quantify the conduction inhomogeneity level. There are multiple published studies in the field that proposed different methods to analyze the conduction inhomogeneity, and three of these methods fit well with the quantitative nature of the project: phase difference mapping, gray-scale co-occurrence texture feature extraction and parametric 3D extrusion. The feasibility of the three methods are evaluated below.
- Phase difference mapping
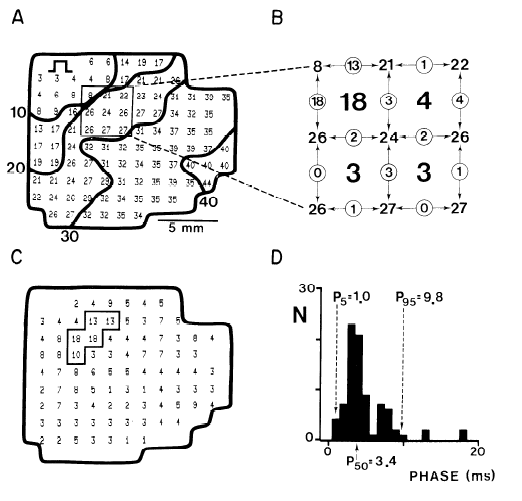
Figure 1. Phase difference mapping for calculation of conduction inhomogeneity. A: activation map. B: Calculation of local phase differences. C: Phase map of maximal phase differences. D: Histogram of phase differences [2].
- Gray-scale co-occurrence texture feature Extraction
Co-occurrence matrix texture extraction is a classical method that has been extensively used in the pattern recognition community [4]. The co-occurrence matrix is defined as the summation of eight sub co-occurrence matrix in the eight directions (horizontal, vertical, diagonal), where each sub co-occurrence matrix’s element is the number of pairs of pixels that have the gray level in the matrix’s direction [4]. Figure 2 shows the generation scheme of co-occurrence matrix.
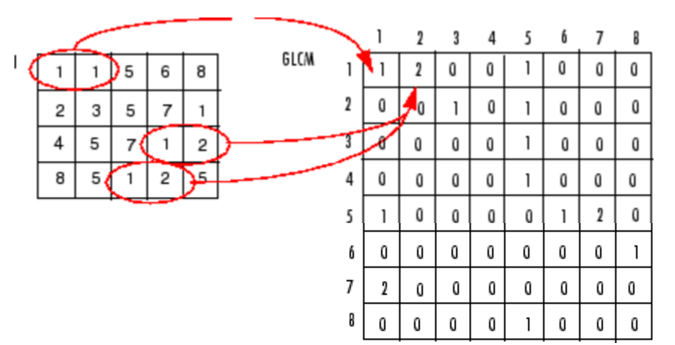
Figure 2 Co-occurrence matrix calculation scheme [3]
The co-occurrence matrix stores texture information that is intrinsic to direct analysis due to large dimensionality of data and high degree of correlation between neighboring textures [5]. As a result, texture features are extracted from the co-occurrence matrix based on statistical calculation. Even though there are many features that can be extracted, two feature parameters, the homogeneity (E) and correlation (Cor), are relevant to the conduction inhomogeneity study of the project.
Because the extrusion height is set to be the parameter value in the constructed “object”, the surface area of a defined scope is directly associated with the spatial inhomogeneity inside the scope, with greater surface area corresponding to greater spatial inhomogeneity. The effectiveness of the map has been demonstrated on 5 simulated pre-treatment and 5 post-treatment maps in which various degrees of inhomogeneity are produced by permutation [7]. According to the experimental result, extruded surface area increases monotonically with the permutation value (which is positively correlated with inhomogeneity).
Even though the parametric extrusion method has not been used on different modalities such as optical imaging, the underlying assumptions of inhomogeneity is the same and the method is thus feasible in the scope of this project.
- Parametric 3D extrusion
Because the extrusion height is set to be the parameter value in the constructed “object”, the surface area of a defined scope is directly associated with the spatial inhomogeneity inside the scope, with greater surface area corresponding to greater spatial inhomogeneity. The effectiveness of the map has been demonstrated on 5 simulated pre-treatment and 5 post-treatment maps in which various degrees of inhomogeneity are produced by permutation [7]. According to the experimental result, extruded surface area increases monotonically with the permutation value (which is positively correlated with inhomogeneity).
Even though the parametric extrusion method has not been used on different modalities such as optical imaging, the underlying assumptions of inhomogeneity is the same and the method is thus feasible in the scope of this project.
Feasibility of Software Cost and System Requirement
The software package can be divided into three parts: optical imaging data processing, cardiac activation map calculation, and inhomogeneity level determination. The running time of the three parts are evaluated separately below.
From the above running time analysis, the optical mapping software package operates in linear time. Since the software is intended for non-real-time data analysis in a research setting, its running time is feasible for the project requirement.
The software package is coded in 64-bit MATLAB (2012b, Mathworks, Natick, MA) and needs to be executed on a 64-bit machine (both Windows and Mac) with graphical display. Since the client’s laboratory carries both Windows and Mac machines with MATLAB 2012b or higher, the system requirement for the software design is also feasible.
- Optical imaging data processing
- Cardiac activation map calculation
- Inhomogeneity level determination
From the above running time analysis, the optical mapping software package operates in linear time. Since the software is intended for non-real-time data analysis in a research setting, its running time is feasible for the project requirement.
The software package is coded in 64-bit MATLAB (2012b, Mathworks, Natick, MA) and needs to be executed on a 64-bit machine (both Windows and Mac) with graphical display. Since the client’s laboratory carries both Windows and Mac machines with MATLAB 2012b or higher, the system requirement for the software design is also feasible.
Feasibility of Data Requirement
The software package has an embedded decision tree for inhomogeneity level determination as discussed previously. The decision tree is produced using random forest decision tree learning algorithm, which requires a large training set to achieve high prediction accuracy. Based on empirical experience, the dataset needs to include at least 100 data points, (100 optical maps). Even though the dataset is a major limitation to the project, Dr. Rentschtler’s lab was able to provide enough recordings for preliminary decision tree learning.
